The Soil Conservation Service (SCS) Type II distribution plays a critical role in constructing hyetograph, which graphically represent the variation of rainfall intensity over time during a storm event. This distribution is particularly valuable for regions with arid climates, where intense, short-duration rainfall events are common, such as the Middle East.
Understanding the SCS Type II Distribution
The SCS Type II distribution is one of four standard rainfall distributions developed by the Soil Conservation Service, each tailored to represent distinct climatic conditions. Specifically, the Type II distribution is designed for areas prone to intense, short-lived rainfall events. This distribution is characterized by a sharp peak at the midpoint of the storm, indicating a concentration of high rainfall intensities over a brief period. This makes it especially suitable for modeling storm events dominated by convective thunderstorms, which can produce significant runoff within a short timeframe.
Applicability in the Middle East
In the Middle East, where flash floods can occur due to the sudden onset of heavy rains, the SCS Type II distribution proves to be highly relevant. Its capacity to accurately represent such intense rainfall events makes it a valuable tool in flood risk assessment, stormwater management, and stormwater design.
The design of pipework within buildings relies heavily on accurately estimating peak rainfall intensity. Undersizing the pipework for potential rainfall events can lead to flooding within buildings, as has often been observed in media coverage of urban flood events. By applying the Type II distribution to model these peak rainfall intensities, engineers can ensure that stormwater systems are designed to handle even the most extreme rainfall events, thereby mitigating the risk of flooding.
Constructing a Hyetograph Using the SCS Type II Distribution
A hyetograph is a critical tool in stormwater management, illustrating the intensity of rainfall over the course of a storm event. To develop a hyetograph using the SCS Type II distribution, follow these steps:
- Determine the Mean Rainfall Intensity: Establish the average rainfall rate for the event.
- Identify the Storm Duration: Define the duration of the storm, such as a 60-minute storm event.
- Apply the SCS Type II Distribution: Use the distribution curve to allocate rainfall intensity over time.
- Construct the Hyetograph: Plot the rainfall intensities over the defined time intervals to create the hyetograph.
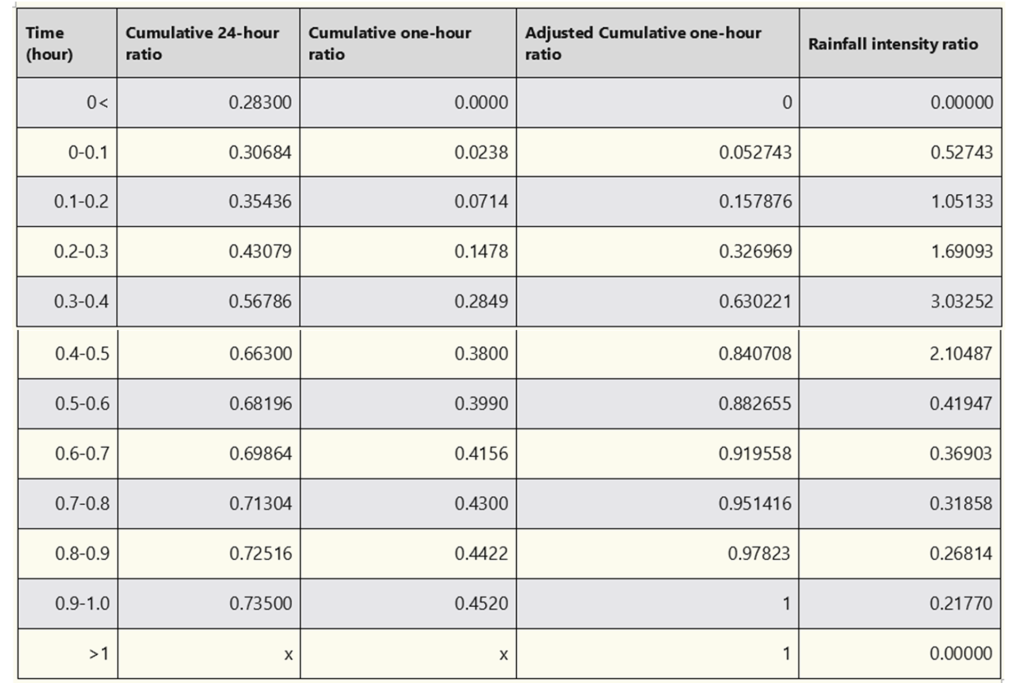
Below is an example of a hyetograph developed for a 100-year return period storm with a 60-minute duration for the Middle East. The accompanying table demonstrates the calculation of the rainfall intensity ratio, while the chart visually represents the resulting hyetograph.


Conclusion
By using the SCS Type II distribution, engineers can produce more accurate synthetic rainfall profiles for various storm durations and intensities. This approach ensures better preparedness for extreme weather events, contributing to more resilient stormwater management systems and reducing the risk of urban flooding.
Using the above method, more accurate synthetic rainfall profile can be produced for any rainfall event and duration.
Visit us at pmt-me.com to explore our growing repository of research, technical articles, product reviews, and expert interviews. We look forward to your feedback and to continuing the conversation about the future of public health engineering.


One Response
nice