

Author: Kshitij Pandey
Date: 08 July 2025

Pressure Management in Modern Water Supply Systems
In high-rise buildings, maintaining consistent water pressure is critical. Booster pumps are commonly employed to ensure sufficient pressure throughout the water distribution system. Traditionally, these systems rely on pressure sensors located near the pump station (in most cases just after the delivery header) to regulate performance. However, this setup often results in systemic inefficiencies, including excessive energy consumption and water wastage.
High pressure maintained across short distribution segments may ensure sufficient pressure at the furthest outlets, but it simultaneously leads to over pressurization in closer zones. This contributes to increased leakages, reduced fixture life, and unnecessarily high pump operation costs. With increasing emphasis on sustainability and operational efficiency, this conventional control method is due for an upgrade.
Status Quo: Conventional Pump Room Pressure Control
In most existing booster pump configurations, a pressure switch is installed immediately downstream of the pump set, typically in the pump delivery header. The system is calibrated to maintain a fixed setpoint pressure (e.g., 4.5 bar) at this location to compensate for pressure losses in the network, especially at the hydraulic index point (i.e., the furthest fixture or highest outlet). The challenges using this approach are:
- Over pressurization near the pump room, leading to leakages and fixture damage
- Unnecessarily high energy usage, particularly during low-demand periods
- Poor adaptability to real-time demand variations
- Wasted water through pressure-sensitive fixtures, greater the pressure greater will be the flow
Proposed Modification: Remote Pressure Sensor at the Index Run
A smarter approach involves placing the pressure sensor at the farthest point in the index run which is the most hydraulically disadvantaged fixture. This allows the booster system to maintain pressure only where it’s needed most, thereby optimizing pump performance and system efficiency.
Controlling water pressure at the end of the index run is a highly effective strategy for optimizing water use. In conventional systems, the pressure sensor or switch is typically installed at the pump outlet. This setup relies on assumed friction and elevation losses along the pipeline to determine pump operation. However, such estimations are often conservative and lead to system over pressurization to ensure that all fixtures, especially the most remote ones, receive the minimum required pressure. This results in higher-than-necessary flow rates at all closer fixtures, leading to:
a) Higher energy consumption: Oversized pumps often operate at less optimal points on their performance curves, resulting in higher energy consumption. This inefficiency can lead to increased operational costs over the long term.
b) Increase Maintenance Costs: Larger pumps generally require more maintenance. Oversized pumps operating at lower capacities may experience increased wear and tear due to issues such as vibration, which can result in higher maintenance costs over time.
c) Noise and Vibrations: Larger pumps can produce more noise and vibration during operation. This can lead to discomfort for personnel working in the vicinity and may require additional measures, such as soundproofing or vibration isolation, to mitigate these effects.
d) Water Hammer: Oversized pumps can contribute to water hammer issues in the system. Water hammer occurs when there are rapid changes in fluid velocity, leading to pressure spikes that can cause damage to pipes, valves, and other components.
e) Difficulty in control: Oversized pumps can be more challenging to control, especially if the system experiences varying demand. Maintaining stable system pressure becomes more difficult when the pump capacity significantly exceeds the actual demand.
f) Potential for cavitation: As mentioned earlier, operating pumps at very low capacities can lead to cavitation, a phenomenon where vapor bubbles form and collapse within the pump, causing damage to the impeller and reducing pump efficiency.
g) Wasted resources: Oversizing a booster pump can result in a system that has more capacity than necessary for typical operating conditions. This excess capacity may represent wasted resources in terms of both energy and equipment.
h) Design Complexity: Designing and implementing systems with oversized pumps can introduce complexity in terms of hydraulic analysis, control strategies, and safety measures. This complexity can make the system more challenging to design, commission, and maintain.
i) Potential for water quality issues: If the flow rate through the system is too low, there may be insufficient water turnover, potentially leading to issues related to water quality, such as stagnation or the buildup of contaminants.
j) Reduced pump life.
9) Considerable increased installation and operational costs due to bigger pipe sizes, insulation, pipe supports, storage, and all the above points.
10) No options for low, medium, and high frequency use selection.
By relocating the control logic or pressure feedback mechanism to the end of the index run, the pump system can regulate output based on the actual pressure conditions where it matters most. This allows for dynamic, real-time adjustment of pump speed and delivery pressure using variable speed drives (VSDs) or smart pressure control valves. Because the index run typically represents the worst-case scenario in terms of pressure demand, maintaining the target pressure at this point ensures that all other areas of the network operate at or below optimal levels without unnecessary over pressurization.
The key components of the system are:
- Pressure switch installed at the farthest outlet
- Variable Frequency Drive (VFD) controlled pumps
- Real-time feedback loop to maintain target pressure (e.g. 3.0 bar) at the index point
- Optional integration with Building Management Systems (BMS) for advanced analytics
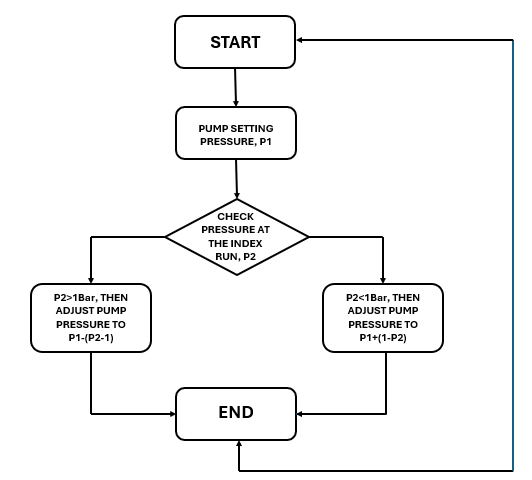
Figure 1 Proposed Logic of the Pump Operation
The modified pressure control will lead to:
- Water Savings: Lower pressure across the system reduces leak rates (which increase with pressure^1.5)
- Reduced flow in pressure-dependent fixtures (e.g., taps, flush valves), thereby reducing the water consumption.
Energy Savings:
- Pump operates at lower head pressure, reducing the energy demand
- Demand-based operation through VFDs minimizes over pumping during low-demand periods
- Reduces wear on mechanical components, leading to lower maintenance costs
Research on pump operation by pump manufacturers shows that pump sets operate at peak capacity during 4.5% of the time only and less than 50% of peak capacity during 86.4% of the time This is illustrated in Figure below.
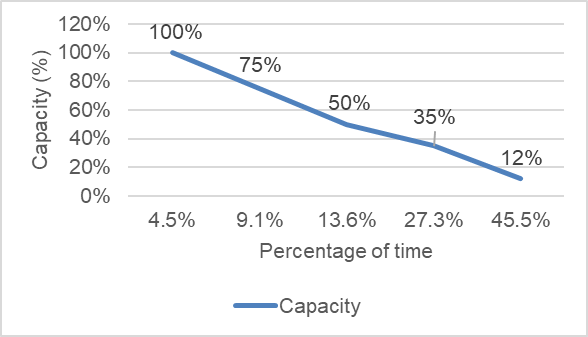
Figure 2 Pump operational capacity vs time
Reference example case
Assumption: 20-storey residential building with 4 apartments per floor having an average floor to floor height of 3.5m.
| Particulars | Value |
| Number of floors | 20 |
| Floor-to-floor height | 3.5 m |
| Total height | 20 × 3.5 = 70 m |
| Apartments per floor | 4 |
| Total apartments | 20 × 4 = 80 |
| People per apartment | 4 |
| Total residents | 80 × 4 = 320 people |
| Daily water uses per person | 150 L/day |
| Total daily use | 320 × 150 = 48,000 L/day = 48 m³/day |
Table 1 Assumed details of a simple residential example building
Pressure Requirements
- At Point of Use (fixture):
Required pressure = 3.0 bar (assumed for showers, taps, etc.) - Static Head:
70 m = 7.0 bar (since 10 m head ≈ 1 bar) - Friction Loss:
Estimated and assumed across vertical + horizontal runs = 1.0 bar - Total Pressure Required at Pump Discharge To ensure 3.0 bar at top floor:
Prequired=7.0 bar (static)+1.0 bar (friction)+3.0 bar (fixture)=11.0 bar
Pressure Control Scenarios Scenario A – Sensor at Delivery Header Pump is set to maintain a fixed 11.5 bar at discharge to cover worst-case demand, assuming: 0.5 bar safety margin No feedback from top floor
Pressure at Lower Floors: At ground floor: Required pressure = 3.0 bar Excess = 11.5 – 3.0 = 8.5 bar Pressure at Top Floor: Static + friction = 8 bar thus outlet gets 11.5 – 8 = 3.5 bar Average Excess Pressure (approx.): Excess ranges from 8.5 bar (ground) to 0.5 bar (top) Mean excess pressure ≈ (8.5 + 0.5)/2 = 4.5 bar
Scenario B – Sensor at Index run and pump adjusts dynamically to maintain 3.0 bar at the top outlet discharge pressure = 11.0 bar therefore the excess pressure at lower floors is smaller: Ground floor 11.0 – 8.0 (static head + friction) = 3.0 bar actual Excess = 3.0 – 3.0 = 0 bar Top floor: gets exactly 3.0 bar Mid floors: reduced excess flow, but not 100% eliminated
Revised Average Excess Pressure: Assume linear profile: Excess ranges from 0 bar (ground) to 0 bar (top) But practically there’s variation — estimate average excess pressure = 1.0 bar
Flow Impact Due to Pressure Flow from a fixture (tap, shower) varies as: Q ∝ √P therefore let’s compare outlet flow in the two scenarios using average pressures: Scenario A (overpressure): P₁ = 3.0 bar (required) + 4.5 bar (excess) = 7.5 bar Scenario B (optimized): P₂ = 3.0 bar + 1.0 bar = 4.0 bar Q1/Q2 = (√7.5)/(√4) = 1.37 Flow rate increases by approximately 37% under overpressure conditions.
Calculated Water Savings If actual required volume = 48 m³/day, then: Scenario A (overpressure): Water used = 1.37 × 48 = 65.8 m³/day Wasted water = 65.8 – 48 = 17.8 m³/day Summary of potential water savings
| Particulars | Value |
| Static height | 70 m |
| Booster pump pressure required | 11.0 bar |
| Pressure with sensor at delivery header | 11.5 bar |
| Average system overpressure (old) | ~4.5 bar |
| Average system overpressure (new) | ~1.0 bar |
| Daily water use (ideal) | 48 m³/day |
| Daily water use (actual with overpressure) | ~65.8 m³/day |
| Water savings | 17.8 m³/day |
| Monthly savings | 17.8 × 30 = 534 m³/month |
| Annual savings | 17.8 × 365 = 6,497 m³/year |
Table 2 Summary of water savings
Calculated Energy Savings
| Parameter | Value |
| Static head (70 m height) | 7.0 bar |
| Friction loss (assumed) | 1.0 bar |
| Required pressure at outlet | 3.0 bar |
| Total discharge pressure needed | 11.0 bar = 110 m head |
| Over pressurized condition | 11.5 bar = 115 m head |
Table 3 Pressure parameters
Hydraulic Power Calculation Hydraulic power (kW) needed to lift water is calculated as:
Phyd= (ρ⋅g⋅Q⋅H)/1000 Where: ρ = water density = 1000 kg/m³ g = gravity = 9.81 m/s² Q = flow rate (m³/s) H = head (m) Scenario A: Over pressurized Setup (11.5 bar / 115 m)
Daily volume: 65.8 m³/day, 37% excess due to overpressure Q= 65.8/86400 = 0.0007616 m³/sec
Head = 115 m Phyd= (1000 X 9.81 X 0.0007616 X 115)/1000=0.860 kW Assume pump + motor efficiency η = 60%, so: P(input)= 0.860/0.6=1.433 kW
Case B: Optimised Setup (11 bar / 110 m)
Daily volume: 48 m³/day ideal due to optimised pressure Q= 48/86400 = 0.0005556 m³/sec
Head = 110 m Phyd= (1000 X 9.81 X 0.0005556 X 110)/1000=0.6 kW Assume pump + motor efficiency η = 60%, so: P(input)= 0.6/0.6=1 kW Summary of Energy Savings Let’s assume pump runs for 12 hours/day (typical intermittent operation):
| Metric | Over pressured | Optimized | Savings |
| Input Power (kW) | 1.433 | 1.000 | 0.433 kW |
| Daily Energy Use | 1.433 × 12 = 17.2 kWh | 12.0 kWh | 5.2 kWh/day |
| Monthly Energy Use | 516 kWh | 360 kWh | 156 kWh/month |
| Annual Energy Use | 6,276 kWh | 4,380 kWh | 1,896 kWh/year |
Conclusion: Smarter, Sustainable Water Pressure Control
Installing a remote pressure sensor at the index run transforms a conventional booster pump system into a dynamic, demand-responsive network. This simple yet impactful intervention reduces water loss, saves energy, improves comfort, and extends the life of plumbing systems. In the era of smart buildings and green engineering, remote pressure sensing represents a forward-thinking, high-ROI solution that enhances both performance and sustainability in water infrastructure.